Meet CypherArc - TRON Explorer of a New Kind
CypherArc is a TRON explorer built to turn browsing data into auditable statements, timelines, and proof without losing your context.
There is a massively huge volume of USDT transactions on the TRON network, and it isn't simply retail users shifting twenty bucks here or there. That is OTC desks, cross-border remittance outfits, payroll processors and massive algorithmic trading companies. A moderately active retail wallet produces only a dozen transfers in the week. A wallet for a business might churn out hundreds every day.
And on top of all that value movement is a completely different economy stacked right above it: Energy and Bandwidth. Unlike Ethereum, TRON does not simply charge native token fees for gas. It is a delegated resource model. Just as how the same TRON addresses can appear utterly dormant on a token view, they could also provide an endless cascade of contract calls fueled by delegated resources from another entity altogether. If you can not read them both in a simultaneous fashion — the value layer and the resource layer at once — then you are only seeing half of it. You can observe a wallet doing thousand dollar USDT transfers with nothing but the goodness of its soul all day long, and unless you reverse engineer how that Energy delegation paying for those 1.5 TRX fee costs is working then it will look like magic. It is not magic. It is a blackbox, and most generic explorers are not designed to explain it.
In practice, you can often work around this with sheer effort. You paste hashes into a text file. You do this because you have a mind as an explorer, and just for that moment in time need to feed your curiosity. But then the curiosity becomes an obligation. It is tax season. Or a record for quarterly reporting to an important partner. What did a particular wallet get up to in October for compliance? Now, all of a sudden it is up to you to justify what happened and for that reason alone those hundreds (if not thousands) of hours spent exploring TRON yield absolutely nothing tangible in front of an expert. You go to start anew and this time you have to do the maths on your own.
Explorer Designed for the Aftermath
This kind of friction is precisely why CypherArc was created. It is a TRON explorer, but to call it simply an 'explorer' underestimates the architectural choice behind it. The new framework ensures that the work you perform while clicking and actual documents produced when proof is warranted are sourced from an identical, mathematically reconciled source.

Website's address_ledger - canonical per-operation journal - indexes every operation across the network, and most importantly each operation computes a running balance. The numbers match when you pull a statement for one quarter and then query the point-in-time balance on the precise second that quarter ends. They look not just similar but work like two sides of the same coin. Software ecosystems tend to export their own stuff into other systems in a way that amounts to dumping the raw DB table and saying good luck, so anything radically different from this is going to be tools mathematically cross-checking their very outputs.

Live environment is TRON today, with Ethereum, Solana, BNB Chain and many others planned. This was no coincidence, starting with TRON. It is the reigning monarch of stablecoin settlement, its resource model can infuriate generic block explorers and building a tool that handles both correctly gives people doing real financial work on-chain an immediate fat upgrade.

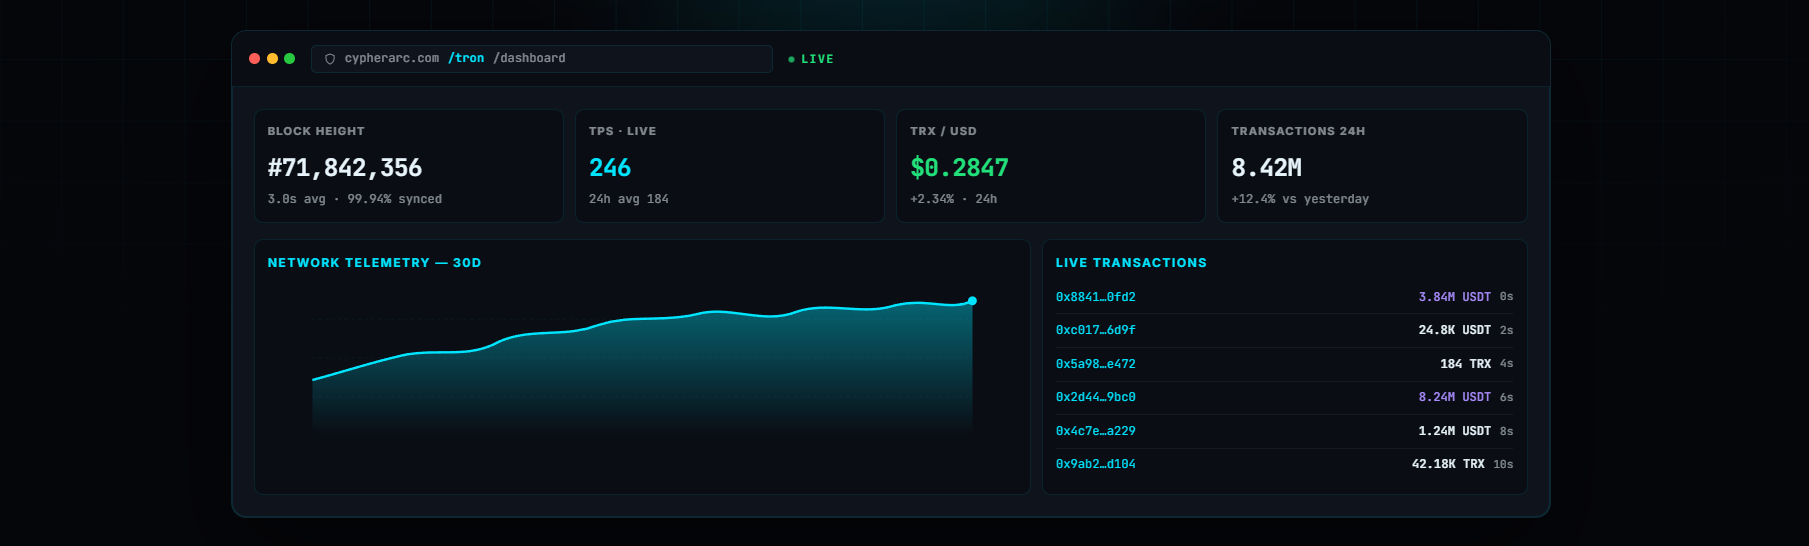
On first opening the site, you do not see a lonely search bar hovering over oceans of whitespace waiting for you to know exactly what it is that you're looking for. You land in a real operating dashboard. Daily panels deliver the real-time network pulse: transaction counts, active accounts, TRX burned and fees with day-over-day deltas alongside. In three seconds you know whether the network is enjoying a snoozy Tuesday or rushing about like it was manic Friday. A chart rotates between price, TPS, volume and Energy burn providing historical context for the daily datapoints.
Next to that is one indicator that should tell you right away this tool actually does comprehend its host chain, the Energy operator leaderboard. It is a ranking of the entities who serve as an Energy aggregator for that ecosystem, selling their staked computation capacity to users looking to run smart contracts without needing to burn TRX. They are ordered by 24-hour volume on the board. If you have ever wanted to know who is powering the colossal industrial scale TRON resource market, or why a particular wallet keeps interacting with this address you don't even remember that interaction occurring at all: here it is right there on your front page. This market does not even appear on most generic explorers, and none of them rank its largest players in real time.
Statements That Survive an Audit
Of all the features that are going to lead to higher adoption of this platform than others, Statements will play a critical role. In the menu bar open Tools, Statements and look for a link to Data methodology. Read it. It is a very technical answer on exactly how the tool determines balances, decimal precision and historical asset pricing. This is a welcome transparency in an industry notorious for treating its data pipelines like black boxes.
As everything derives from the address_ledger, every statement is reconciled against a canonical daily balance. Your calculated closing balance for the requested period needs to equal the total of all closures by day in a network. Such a green reconciliation badge appears at the top of your report if it does. TRX and TRC20 six-decimal tokens reconcile down to their lowest common denominator. Historical fiat values are expressed in terms of the price at a specific time, not today's trailing average.
The setup takes seconds. Paste a TRON address. It does not need to be yours. Select an asset that the wallet really did interact with. Set a UTC date range. Choose one of the pre-defined windows (e.g., last calendar month, previous quarter and year-to-date) or configure a custom window. Hit build.

The result is a document you would be comfortable giving to an accountant. On the top: opening balance, closing balance and net change. Just below that is the reconciliation banner. But expand it, and the tool explains its math: opening balance plus incoming funds minus outgoing funds minus explicit fees equals closing balance. That is really middle-school math, but it is math that most block explorers never show.
Visual cash-flow bars and hourly balance charts are drawn below the math. Then comes the ledger itself. Each operation gets a new row: UTC timestamp, reference hash, transaction type and counterparty, amounts in and out, specific fees paid and running balance. If there are fees, they stand alone in their own column. Spam transactions and dust attacks are specifically labeled so as to not confuse a reviewer reading the document cold.
Think of how much human suffering this saves. Freelancers, for whom every dollar of quarterly USDT revenue can make a difference in the long run, do not need to export a CSV and spend two hours deleting spam rows from it, correcting broken timestamp formatting along the way while also guessing what this particular asset was worth five or six months ago.

DAOs are able to release their treasury inflows and outflows on a monthly basis with the precision of mathematics, so that auditors from within the community can check where money has gone without needing core team members to transfer vast, easily tweaked database dumps. compliance officers investigating a suspicious entity can produce a clean, branded PDF of what the suspect wallet has done which they attach to a formal suspicious activity report safe in the knowledge that those numbers will stand up should regulators come calling later:

The tax pros are last, of course. For those who work in crypto taxation, your existence is something of an iterative spreadsheet hell. Your clients come in with exports from 3 different exchanges and 4 different wallets, none of which match. On a Tuesday, the Opening balance is not equal to Closing balance on Monday. You spend a fortune on thousands of billable hours every year trying to fix these files by manually reconciling, searching for the missing fee or failed transaction that upset the entire ledger right now. So CypherArc is a way to give those professionals something like decentralized gravity, which enforces its own accounting. The math works by default.

So what exactly do Statements give you, and why are they such an enormous step up from the industry standard?
Validated opening and closing balances tied to real period boundaries.
An available balance that continues to run after every operation.
Mathematical reconciliation against a separate network aggregate.
CSV exports — uncapped.
A citable paper describing the math.
For wallets with lots of operations in stablecoins, the tool creates two statements: USDT statement and TRX fee statement separately. This is an absolutely essential architectural decision since nearly every tax and accounting framework on the planet classifies stablecoin principal as a separate heap of taxable events than native-token gas-fees.
Information Density of an Address
In order to decipher how CypherArc transforms the day-to-day flow, we need to first examine how it processes a commonplace address page. Unlike others, it does not simply catalog transfers in chronological order and leaves you to decipher the meaning. It tries to answer the most obvious questions before you ever have to ask.
They give you an AML risk tier right at the top of your list, next to the address. Not obscured behind a paywall click or hidden away under an additional analysis tab; it is front and centre, alerting you straightaway should you be reviewing one of their known high-risk entities. The split in holdings is done intelligently: staked and liquid TRX are separated from USDT and other tokens, conscious that even if a wallet has money this can be misleading when the capital is trapped inside governance.
Quotas on Energy and Bandwidth are shown not only as the current numbers at a snapshot in time, but also as historical charts. This is crucial. If a wallet has 0 Energy today, it means literally nothing if we want to know whether or not that same wallet had one million Energy on Tuesday of last week when triggered by some specific expensive smart contract. Which means you require the historical context to know what was possible in terms of wallet capacity, at the time when this event took place.

Tabbed views list incoming and outgoing volume separately. You can know the behavioral profile of an address in three seconds. Is it mainly just a receiver extracting other funds from the retail victims? Are you a sender paying out payroll? Or is it a high-speed router doing both at the same time? Tabs on the bottom allow immediate access to resources, analysis, statements and point-in-time balances for that address so you never have to navigate back to a main menu ever again.
Click on a transaction hash, and the sidebar slides out. It does not only find the transaction details but also provides action. Actors in Graph Visualizer gives the network topology:

Transfer Timeline — see the flow of time. Put the event into an active case file in your encrypted vault. Export a standalone PDF receipt of the transfer you can send to your client. The interface assumes that locating a transaction is step one, and it was all designed to accomplish the second part. This isn't an explorer for a mere salesperson; this is a platform built by someone who has to do something with the data.
Seeing the Shape of Time
Statements are meant to show what transpired. They are absolute and mathematical, though a little tedious. Transfer Timeline is for a better understanding of how it occurred. Graphics that are visually intuitive and designed for pattern recognition.

Pick an asset and load a wallet into the Timeline. The canvas draws a time axis in the horizontal direction. Each transfer is a bubble: green, above the line for incoming; red below the line for outgoing. The actual transfer amounts are printed on the bubbles themselves, which means you can avoid that tedious random access of hovering your mouse over fifty different pieces of data to read the numbers.
The model of behaviour is instantly readable on chain. A retail user who is paid twice a month and slowly spends it away on coffees and subscriptions looks nothing like an algorithmic trading bot that executes micro-arbitrage every twelve minutes. A wallet that quietly holds onto capital for half a year and then vomits it in panic-like succession over the course of three hours is one hell of visual signature on the board, but near-impossible to catch scanning through a data sheet full of timestamps.
You expand them once you see a potential counterparty to trade with. It appears as your own parallel lane on the board in an exactly synchronized time axis. If you do this a couple of times, then an address and action becomes the choreography for multiple actors. You can see in the ledger when a centralized exchange wallet atomically brooms all funds from 12 deposit addresses, or watch as just one withdrawal trickles down through three layers of intermediary wallets before laying to rest directly into some cold storage.
Importantly, the board persists its state. Your opened lanes, applied filters and zoomed timeline — all of that does survive a session. You will be able to drop digital stickers onto particular bubbles and label these with either a risk, proven theory or something you want an answer for! The times when you have to tell your boss or your client the reasons why a specific group of addresses are actually one single entity shifting money around that should be explained with frantic hand gestures and highlighted spreadsheets do not matter anymore. You turn on the presentation mode for Timeline and you merely present them with an image. Visual patterns are digested at a speed more than 1000 times faster in the human brain than columns of text; the Timeline simply exploits that physical fact.
Topology Over Chronology
The Timeline shows you at what point things happened; the Graph Visualizer is how we graph out who talks to whom. You throw away time altogether and lay out the connectivity of your network - in different layouts - here's how radial layout looks:

You set this graph up with 4 simple parameters — the mode, which asset it is aiming at, a flow direction and how deep. The canvas renders the network. Nodes are addresses, and the size depends on total transaction volume. Edges represent the transfers that connect them, weighted by value moved.
There are three contextual tabs. The Nodes table provides a ranking of each address currently on the canvas by connectivity and hop distance from your starting seed. Those addresses which put themselves in the high-betweenness point get a special kind marker. The Connections table shows every edge as a single two node relationship from-to pair, something you can export.

However, the real game changer is an Evidence tab. A thick line between two nodes is simply an image in most network visualisation tools. Within CypherArc, the Evidence tab follows that very line all the way back to its source underlying ledger entries which gave birth to it. You are not simply offering a shiny graphic of interconnections, you are making an argument about visual information steeped in citable and unarguable proof.
We have customized the workflow around Expand. If you click on a node, hit Expand and the graph will go fetch that address's immediate neighbourhood, integrating it into your existing canvas. You trim the branches that do not lead to anything, you stick actors of interest in place and type text notes directly on top of the nodes.
This is how investigations actually happen. It begins with a seed address. On the first hop, you only see a few apparently normal counterparties. Yet one of them stands out with an edge weight that looks completely misaligned. You expand it. All at once, the graph explodes outwards and a giant nexus opens around your original seed leading to three different darknet markets as well as a DEX. Graph Visualizer fills the gap between just having an ominous gut feeling about a wallet, and being able to structure that bad faith, and why.

Due to TRON's shared infrastructure of retail users, the chain is bombarded with high volume from exchanges, Energy aggregators and major smart contracts interacting constantly which means running an unfiltered raw depth-two search on somebody's normal wallet will yield dozens of unrelated actors. This is the six-degrees-of-separation problem on a blockchain; dig hard enough, and everybody connects to Binance.
However, on a specialized illegal wallet or even highly structured entity, the graph stays tight. The same counterparties keep popping up again. You will see no connections to big exchanges; you only see links going into offshore mixers. This creates hubs that look peripheral on the raw ledger, but control all of value flow when charted. The kind markers recognize this fact explicitly by flagging the nodes that are structural bridges. Drawing attention to a high-betweenness hub identified on that visual canvas is far more compelling than describing routing topology in raw text. It distills what might be a very complicated technical argument into an image.
Pinning Down the Exact Moment
Remember that nightmare you have — and maybe it's just me — no, not the one about going to work naked; but rather blockchain compliance. You have a statement, and you know the closing balance at month-end. Except somebody wants an independent verification of that number, at the precise moment it is mentioned without referencing this statement.
And Balance Point is there to put that nightmare away for good. You give an address and select your temporal weapon: current live holdings, holdings at a highly narrowed UTC datetime to the second or by block height.

They use the same math that is used to power Statements and those historical queries. It takes the closest canonical daily snapshot and rolls every raw operation forward mathematically to your requested second. If your Balance Point is the same as your Statement close, you are done and we have confirmed it with data that relies on third-party sources. Then if it diverges, you have a nice precision anomaly to study bounded by mathematics rather than just general worry.
Secondly, CypherArc also doesn't consider the resource economy a second-class issue. We are only scratching the surface here with operator leaderboard on dashboard. Each Energy provider is allocated an analytics screen that provides their delegation volume, internal vs customer resource burn and liquidity pool structure. You can see exactly who is doing what to keep the network alive and how much capacity they have, as all this data has a public record in heavy rotation.
It provides thirty to ninety day charts showing total delegated Energy and Bandwidth across the network along with a historical market rate. This is not trivia. It is investigative ammunition. The only way we know whether they actually paid network average market price for Energy on the very day a wallet deployed an eye-wateringly huge smart contract is research; most often those researchers, through data mining or human experience of particular service-providers, end up looking at cluster-upon-cluster to see exactly why their provider was overpaid. Was it an ineffective contract or was it a transfer of value that looked like one.
Block pages display consumption with SUN pricing equivalents, and transaction pages separately delineate resource delegations from actual value transfers of TRC20. This is a vital distinction. A badly designed block explorer will show a delegation of Energy as the transfer of tokens. It is not. One is renting computational power and the other one is transferring capital permanently. Confounding them in a financial statement is catastrophic. CypherArc, by design, does not allow for that error. When traffic surges, live feeds also pause instead of refreshing faster than human sight. It is a tiny little UI choice, but it says something about how you built software to be used by real human beings.
Private Investigation Architecture
All of this data is public. The ledger is public. The counterparties are public. The resource allocations are public. However, the work that you do to make sense of it — the hypotheses you establish and explore; frameworks for how various elements within a domain relate and interact with one another; conclusions based on your analysis — is kept largely between yourself. When you are following up on a stolen fund cascade, or tracing back from an exploited DeFi yield strategy of some high-net-worth individual, the last thing you want is for your very early notes to be publicised or even worse visible and saved to disk unencrypted at someone else's server.
To solve this problem, the Basic tier, running about fifty euros a month, introduces an encrypted investigation layer over the entire explorer. Thus we have the digital equivalent of placing tracing paper over a physical map. You draw on the map but only you can see the ink.

Starting with the Private vault. To be entirely clear, this is not a crypto wallet. It has no private keys, and it never calls the blockchain. It cannot sign transactions. It is your brain, stored in a secure client-side encrypted environment. It contains your tags, case notes, collection memberships, and overlay choice. The CypherArc servers never see your plaintext because it is encrypted locally in your browser before any sync occurs. Even if the database had been hacked, your notes for investigation would be gobbledygook.

It opens the vault, which pretty much alters your experience of exploring. You can use Collections to group labeled addresses and transactions into logical buckets. Your first collection is about an established group of OTC brokers based in Dubai, while your second wholly independent from the other tracks entities related to a current fraud investigation. You can turn them on and off independently. If you're looking at this month, you don't want to see OTC labels from last month on your screen. You turn them off. It helps keep the visual noise manageable while keeping that flexibility there.
Cases are one level above collections, and offer an automation capability that is verging on mandatory: intersection detection. For example, if today you tag a suspicious address looking to use it in a brand new money-laundering case but that exact same address was tagged four months ago for an unrelated collection involved with the hack of an exchange, the overlaps are flagged immediately by this system. It connects the dots before you even know there are dots to connect. Given the volatility of institutional memory this is a real lifesaver for compliance teams with multiple reviews happening simultaneously. Cases also preserve a timeline of chronological, multilingual notes while they apply an analytics visual focus filter so that the specific actors you are investigating right now remain highlighted whilst all other network noise recedes into the background.

Real investigations are messy. They are non-linear. They loop back on themselves. Ask one question, generate three more questions and all of a sudden you forget why the hell an address three weeks ago inspired so much care. The workspace allows you to never have the cognitive labor of repeating yourself because we carry your encrypted labels across Statements, Timelines and Graphs on live explorer itself. The label stays with the address.
Overlay settings tell you how to control the noise. When it comes right down to it what you expose of yourself is up to you: public risk tags from CypherArc's own intelligence unit, your very own internal vault tags, even hyperactive spam blocking that helps conceal dust attacks; or cover any candidates tagged by algorithms but not yet vetted.

A Workspace dock drops down out of the header, containing a Notebook that you can use to quickly write things without getting into note-mode and to capture hashes and links. It allows you to store an interesting address without disrupting your visual flow or sidetracking from a graph. The Portfolio tab is designed to allow the tracking of up to twenty addresses in read-only mode, displaying their collective TRX and USDT value over time. No keys, no wallet connection; it simply monitors the public ledger on your behalf. And finally, the Support tab allows you to follow a direct route to the people behind development — something we feel is an indispensable inclusion for any product which openly admits it is still in Beta.
Free Utilities
Regardless of whether you ever sign for a paid tier, CypherArc runs some publicly available utilities that deserve to be in your bookmarks. USDT Blacklist: A dynamic, full list of all TRON addresses Tether has frozen. It has the freeze transaction hash, precise time, and locked stablecoins value. It updates every fifteen minutes. It's just good counterparty hygiene to do a quick check before engaging with any new massive customer when you already have billions of dollars of frozen assets throughout the network.

There is also an upcoming update - Screener tool, which can be seen in the interface. In a nutshell, it is an ensemble of automated analytic rules that scans addresses for certain behaviours: exchange deposit behaviour, whale-scale flows, exposure to sanctioned entities and systemic spamming. Once operational, it is the ultimate first-pass filter that helps you quickly profile a wallet's risk surface before jumping into an exhaustive manual review.
Bottom Line
The pricing is straightforward. Live chain browsing does not require an account or incur any fees. Get full access to the heavy analysis tools — Statements, Transfer Timeline, Graph Visualizer and Balance Point simply by logging in. More on the Basic tier at about fifty euros a month includes access to the workspace, vault and cases within encrypted investigation tools. Enterprise scaling and access to API on request.
CypherArc is betting very specifically, but a calculated bet nonetheless. They are wagering that the days of treating blockchain exploration and blockchain documentation as two completely parallel workflows has come to an end. The data that you use to reconstruct the events should exactly be the same type of evidence which can be handed over to a tax authority, a judge or an auditor and say: this is what happened.

With the tools already at work in the beta — self-validated statements of math, timelines that paint complex routing charts into living vines, graphs rendering visual topologies to immutable proof, and point-in-time balances putting an end to debates over historical holdings — it is a wager already paying dividends. More chains, more features — that is what the roadmap promises. In its current state CypherArc is engaged in heavy-lifting financial work that this space has a serious need for.